|
|

|

| Currently viewing: Finance director's report / Next: Directors' responsibility and approval |
Finance director's reportWe continue deployment of capital into higher returning businesses.Revenue for the year increased by 11% to R65.1 billion. Good revenue growth was achieved in Equipment southern Africa which was up by 17% mainly as a result of the inclusion of the EMPR Bucyrus business for the full year and in Automotive and Logistics, which was also up by 17%. The weakening rand added revenue for the year by R2.1 billion. Earnings before interest, taxation, depreciation and amortisation (EBITDA) increased by 15% to R5 623 million with depreciation and amortisation increasing by 9%, while operating profit rose by 18% to R3 527 million. The Equipment businesses in southern Africa and Russia performed well in difficult trading conditions particularly in the mining sector. Equipment southern Africa increased operating profit by 9% to R1 678 million assisted by a strong performance from the EMPR business. Equipment Iberia incurred a loss of R16 million which was substantially below the loss of R139 million in the prior year. No further restructuring charges were incurred this year despite a continued decline in demand in Iberia. The Automotive and Logistics division performed well in a competitive trading environment, once again improving operating margins and increasing operating profit by 28% to a record R1 479 million for the year. The increase in the company’s share price since September 2012 resulted in a charge of R121 million for the year in respect of the provision required for cash-settled Share Appreciation Rights (SARs) previously awarded to employees (2012: R25 million). The total negative fair value adjustments on financial instruments of R47 million (2012: R93 million) mainly relate to the cost of forward points in foreign exchange contracts in Equipment southern Africa. Finance costs increased by R156 million to R983 million mainly owing to higher average debt levels during the year. Additional interest charges of R92 million were incurred on the debt utilised to fund the acquisition of the southern Africa and Russian EMPR businesses Exceptional charges of R119 million mainly comprise impairments of goodwill in Handling Netherlands (R28 million) and Motor Retail Australia (R40 million) together with losses on disposal of subsidiaries and investments of R43 million. Taxation for the year was R804 million. The charge includes impairments of deferred tax assets of R17 million. The effective taxation rate (excluding prior year taxation and taxation on exceptional items) was 31.7% (2012: 32.7% excluding secondary tax on companies (STC)). The effective rate is lower than last year mainly owing to reduced losses in Spain. Income from associates increased by 31% to R185 million (2012: R141 million) again driven by a strong performance from the Equipment joint ventures. The non-controlling interest in the current year’s earnings includes R36 million representing the dividends paid to the holders of 14 485 013 ordinary shares in terms of the BEE transaction concluded in 2008. These shares are not included in issued shares for purposes of calculating headline earnings per share (HEPS). HEPS increased by 26% to 860 cents (2012: 680 cents). Cash flowCash generated from operations increased significantly to R4.3 billion (2012: R43 million utilised). Good equipment deliveries in the second half resulted in a reduction in working capital this year of R0.5 billion (2012: R3.1 billion increase). This contributed to a net inflow of funds this year of R653 million (2012: R2.9 billion outflow). This was also a significant improvement on the cash outflow of R2.9 billion reported at the interim. A net R1.3 billion was applied in investing activities during the year. This mainly comprised R497 million incurred to acquire the Bucyrus business in Russia and the Logistics acquisitions in South Africa and net property, plant and equipment expenditure during the year of R701 million.
During the year the R1 billion Bucyrus funding note was extended into 2015 and a R700 million maturing bank loan was extended into 2019. The long-term debt maturity profile at 30 September 2013 was 71% (2012: 70%). However, in addition to a number of bonds, the R1.2 billion BEE loan is scheduled to mature in 2015 and it is our intention to address certain of these maturities in the 2014 financial year. In South Africa, short-term debt due for redemption includes commercial paper (CP) totalling R1 200 million. The CP market has remained liquid during the current year with spreads narrowing and we expect to maintain our participation in this market. The company has unutilised debt facilities with domestic banks totalling R4 606 million at30 September 2013. The offshore facilities include five bilateral loans totalling £100 million (R1 630 million) which were undrawn at 30 September 2013. Other offshore unutilised bank lines amounted to the equivalent of R1 720 million. Of the total unutilised facilities of R7 956 million at September 2013, R4 865 million are considered to be committed facilities. The company’s credit rating of A+ was recalibrated upwards to AA- (Stable Outlook) at the time the South African sovereign credit was downgraded by Fitch Ratings. The company’s credit rating was reaffirmed by Fitch Ratings following the formal credit review in February 2013. The weaker rand resulted in an increase of R1 671 million in shareholders’ funds (2012: R276 million) and increased net debt at September by R124 million.Gearing in the three segments are as follows:
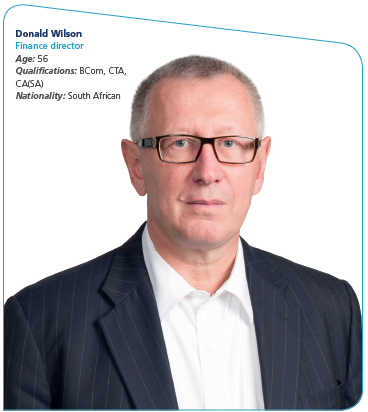
Accounting policiesThe annual financial statements have been prepared in accordance with International Financial Reporting Standards (IFRS) as issued by the International Accounting Standards Board (IASB). The basis is consistent with the prior year except for the adoption of the amended Headline Earnings Circular 2/2013 which had no impact on presentation, recognition or measurement. The revised accounting standard, IAS 19 Employee Benefits, will be effective in our 2014 financial year and will be applied retrospectively. The new standard will impact the measurement and presentation of the Barloworld Pension Scheme (UK) (defined benefit scheme). The new standard will in future result in fund expenses being expensed directly in the year incurred and in addition an interest charge will be incurred on the deficit in the fund. The impact on the estimated defined benefit expense in 2013 based on the new standard would have been an administration cost of £1.5 million, an interest charge (on liabilities and assets) of £2.8 million. This compares to a net defined benefit credit to operating expenses of £3.0 million under the existing IAS 19 in the current year.Integrated Financial Value ModelDuring the year the company launched its Integrated Financial Value Model (IFVM). The model applies various financial value metrics to the group and divisions to measure value creation and is applied in the strategic decision-making processes within the group. The model focuses management on the key “value drivers” in their businesses that drive value creation.DividendsDividends totalling 291 cents per share were declared in respect of this year’s earnings (2012: 230 cents). Of the issued shares of 231.3 million, only 227.7 million are entitled to receive dividends. The majority of shares not entitled to dividends relate to the Black Managers Trust (BMT) and Education Trust (ET). The dividends declared this year are covered 2.8 times by headline earnings (2012: 2.8 times).Going forwardThe group return on shareholders’ funds of 12.8% in the current year was up on the 11.3% achieved last year. The group continues redeployment of capital into higher returning businesses, which together with a projected return to profitability in Equipment Iberia, should contribute to improved returns in 2014.DG Wilson |
||||||||||||||||||||||||||||||||||||||||||||||||||||||||||||||||||||||||||||||||||||||||||||||||||||||||||||||||||||||||||||||||||||||||||||||||||||||||||||||||||||||||||||||||||||||||||||||||||||||||||||||||||||||||||||||||||||||||||||||||||||||||||||||||||||||||||||||||||||||||

|